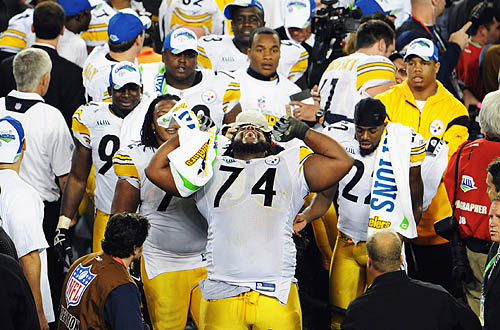
Photo Credit: Robin Rombach/Post-Gazette (Willie Colon celebrates Super Bowl XLIII)
Since the Steelers’ 2009 Training Camp is upon us, I thought it was a good time to take a look at the group that has caused Steeler Nation the most concern each of the last two years, particularly from a pass protection standpoint. I realize that we have seen a drop in the Steelers’ rushing game in 2008, but the issue that has caused the most serious concern is that Big Ben has been sacked nearly 90 times in the last two seasons. Steelers fans have discussed the lack of pass protection at great length the past two seasons, and we have voiced great concern over the fact that the Steelers have passed on several OL draft picks that we wanted. Because of these concerns, I wanted to compare the level of defenses that the OL has faced in the 2007 and 2008 seasons. The Steelers faced a much easier schedule in 2007 than 2008 but still had approximately the same number of sacks per season. So I asked “Was it possible that the OL was actually better in 2008 than 2007, just that they faced a much stronger defensive schedule?” I thought it possible. So, lets take a look at the numbers (from www.pro-football-reference.com).
For the past two seasons, I compiled the following defensive statistics for Steelers’ opponents:
- Defensive Rank in Points (Opp D Rk-Pt)
- Defensive Rank in Yards (Opp D Rk-Yd)
- Defensive Rank in Rush Defense (Opp D Rk-Rush)
- Defensive Rank in Sacks (Opp D Rk-Sk)
- Number of Defensive Sacks (Opp No. Sk)
- Number of Defensive Sacks per Game (Opp Sk/Gm)
I also compiled or calculated the following statistics for the Steelers’ offense:
- Steelers’ Sacks Allowed for each game (Pit Sk Allowed)
- Steelers’ Sacks Allowed minus Opponents’ Sacks per Game (Pit Sk All – Opp Sk/Gm)
I pulled numbers for Opponents’ Defensive Ranks in Points, Yards, and Rush Defense because they give a good idea of the general quality of the defense overall. I included rush defense instead of pass defense because strong run D tends to be pointed to as evidence of a physical defense. Obviously, I compiled the Sacks data because the number of sacks given up the last two years are our primary concern right now. However, even if an opposing defense wasn’t highly ranked in terms of sacks, a high quality, physical defense would more likely create situations where Ben would hold the ball longer. For example, top ranked defenses would be more likely to create 3rd and longs or to cover the WRs down the field, thereby adding more stress to the OL.
Below are the tables containing the 2007 and 2008 data. I added a line below the bottom row of numbers (which is in bold) to let you know whether the bolded numbers are averages of the columns above or the sum of the column above. The data for 2007 is shown in the first table.
| 2007 Opponent | Opp D Rk-Pt | Opp D Rk-Yd | Opp D Rk-Rush | Opp D Rk-Sk | Opp No. Sk | Opp Sk/Gm | Pit Sk Allowed | Pit Sk All – Opp Sk/Gm |
| Cleveland Browns | 21 | 30 | 27 | 26 | 28 | 1.75 | 1 | -0.75 |
| Buffalo Bills | 18 | 31 | 25 | 29 | 26 | 1.63 | 1 | -0.63 |
| San Francisco 49ers | 20 | 25 | 22 | 22 | 31 | 1.94 | 2 | 0.06 |
| Arizona Cardinals | 27 | 17 | 9 | 13 | 36 | 2.25 | 4 | 1.75 |
| Seattle Seahawks | 7 | 15 | 12 | 4 | 45 | 2.81 | 3 | 0.19 |
| Denver Broncos | 28 | 19 | 30 | 17 | 33 | 2.06 | 4 | 1.94 |
| Cincinnati Bengals | 24 | 27 | 21 | 32 | 22 | 1.38 | 1 | -0.38 |
| Baltimore Ravens | 22 | 6 | 2 | 20 | 32 | 2.00 | 3 | 1.00 |
| Cleveland Browns | 21 | 30 | 27 | 26 | 28 | 1.75 | 4 | 2.25 |
| New York Jets | 19 | 18 | 29 | 25 | 29 | 1.81 | 7 | 5.19 |
| Miami Dolphins | 30 | 23 | 32 | 24 | 30 | 1.88 | 5 | 3.13 |
| Cincinnati Bengals | 24 | 27 | 21 | 32 | 22 | 1.38 | 0 | -1.38 |
| New England Patriots | 4 | 4 | 10 | 2 | 47 | 2.94 | 3 | 0.06 |
| Jacksonville Jaguars | 10 | 12 | 11 | 11 | 37 | 2.31 | 5 | 2.69 |
| St. Louis Rams | 31 | 21 | 20 | 23 | 31 | 1.94 | 4 | 2.06 |
| Baltimore Ravens | 22 | 6 | 2 | 20 | 32 | 2.00 | 0 | -2.00 |
| 20.5 | 19.4 | 18.8 | 20.4 | 31.8 | 2.0 | 47 | 0.95 | |
| Avg | Avg | Avg | Avg | Avg | Avg | Total | Avg |
And, here is the data for the 2008 season:
| 2008 Opponent | Opp D Rk-Pt | Opp D Rk-Yd | Opp D Rk-Rush | Opp D Rk-Sk | Opp No. Sk | Opp Sk/Gm | Pit Sk Allowed | Pit Sk All – Opp Sk/Gm |
| Houston Texans | 27 | 22 | 23 | 27 | 25 | 1.56 | 2 | 0.44 |
| Cleveland Browns | 17 | 26 | 28 | 31 | 17 | 1.06 | 2 | 0.94 |
| Philadelphia Eagles | 4 | 3 | 4 | 3 | 48 | 3.00 | 9 | 6.00 |
| Baltimore Ravens | 3 | 2 | 3 | 12 | 34 | 2.13 | 3 | 0.88 |
| Jacksonville Jaguars | 21 | 17 | 14 | 20 | 29 | 1.81 | 3 | 1.19 |
| Cincinnati Bengals | 19 | 12 | 21 | 30 | 17 | 1.06 | 0 | -1.06 |
| New York Giants | 5 | 5 | 9 | 6 | 42 | 2.63 | 5 | 2.38 |
| Washington Redskins | 6 | 4 | 8 | 27 | 24 | 1.50 | 4 | 2.50 |
| Indianapolis Colts | 7 | 11 | 24 | 19 | 30 | 1.88 | 2 | 0.13 |
| San Diego Chargers | 15 | 25 | 11 | 22 | 28 | 1.75 | 4 | 2.25 |
| Cincinnati Bengals | 19 | 12 | 21 | 30 | 17 | 1.06 | 0 | -1.06 |
| New England Patriots | 8 | 10 | 15 | 15 | 31 | 1.94 | 1 | -0.94 |
| Dallas Cowboys | 20 | 8 | 12 | 1 | 59 | 3.69 | 5 | 1.31 |
| Baltimore Ravens | 3 | 2 | 3 | 12 | 34 | 2.13 | 3 | 0.88 |
| Tennessee Titans | 2 | 7 | 6 | 5 | 44 | 2.75 | 5 | 2.25 |
| Cleveland Browns | 17 | 26 | 28 | 31 | 17 | 1.06 | 0 | -1.06 |
| 12.1 | 12.0 | 14.4 | 18.2 | 31.0 | 1.9 | 48 | 1.06 | |
| Avg | Avg | Avg | Avg | Avg | Avg | Total | Avg |
Taking a look at this data, there are a few points of interest that stick out to me. First, the quality of defensive opponent was clearly higher in 2008 than in 2007. The average defensive opponents’ ranking jumped from around 20 in yards and points to around 12 from 2007 to 2008. The Steelers played 3 games against top 10 defenses in 2007 and 8 games against top 10 defenses in 2008. Conversely, in 2007, they had 10 games against defenses ranked 20 or lower in points allowed (8 for yards allowed), while in 2008 it was 3 games against defenses ranked 20 or worse in points (4 for yards). So, clearly, the 2008 OL faced much higher quality defenses for a much larger portion of the season than in 2007.
When reviewing the numbers for opposing defenses’ sacks, it appears that the two seasons were close to even. The average defensive rank in sacks for 2008 was only slightly higher than 2007, and the average number of opponents’ sacks was actually slightly lower in 2008 than 2007. However, I think that the 2008 numbers are skewed by the Browns and Bengals. They had 17 sacks each and accounted for 4 games in 2008. It’s worth noting that the Steelers only allowed 2 sacks total to those two teams (week 2 against the Browns, when they still had hope).
I say that these numbers skew the 2008 data because, in the last 20 years, only 5 defenses have had 17 or fewer sacks for the season. Oddly, three of them were this season (Chiefs had 10!), and the Steelers faced 2 of them, holding both teams without a sack in 3 games. Because the only sacks given up against these two teams was in week 2, I think this is further indication that the OL improved as the season progressed. But, since both teams were also so poor pass rushing, holding them sackless doesn’t tell much.
Anyway, statistically, the major differences between the defenses faced in 2007 and 2008 were in overall quality, moreso than overall pass rushing. In my opinion, the huge jump in overall quality of defenses faced from 2007 to 2008 is enough to suggest that the OL has improved. Again, when facing a string of quality opponents, one would have expected that the weak link on the team would have faced more situations of adversity, probably leading to even more sacks in 2008. Instead, the number held relatively steady; still too high, yes, but steady. But, I don’t want to rely on just the average difference in the quality of opposing defense. So, let’s take a look at a couple of graphs that I think will show better a trend of improved play by the Steelers’ OL.
Below are two graphs: one for 2007 and one for 2008. In each graph, the red line graphs the number of sacks that the Steelers gave up in each game. The blue line graphs the average number of sacks per game of the opposing defense (i.e. the opposing defense’s total sacks for the year divided by 16).
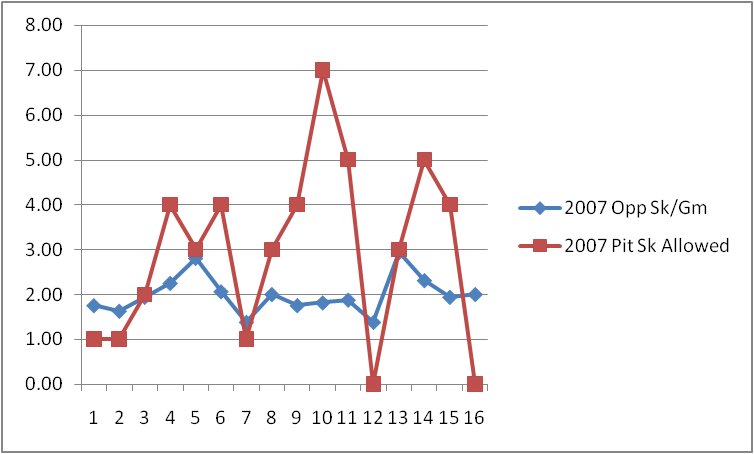
2007 Defensive Opponents’ Sacks per Game versus Steelers Sacks Allowed each game
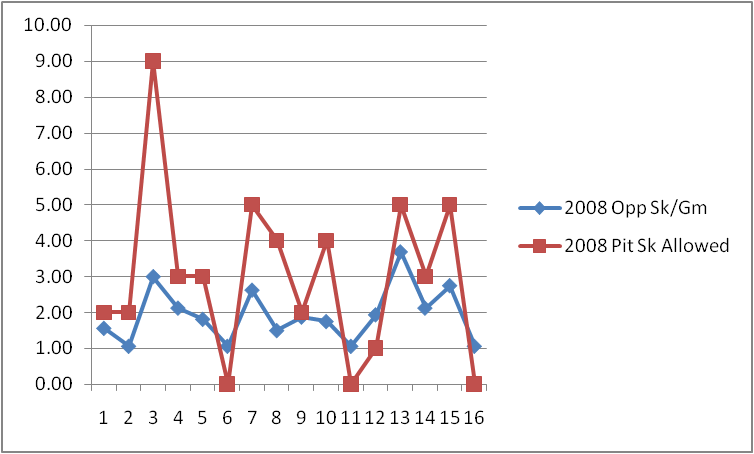
2008 Defensive Opponents’ Sacks per Game versus Steelers Sacks Allowed each game
When I look at these two graphs, a couple of things jump out at me. First, the worst spikes in Steelers’ sacks allowed occurred between the middle of 2007 and early 2008. So, it appears that the worst period for Steelers pass protection was between week 8 of 2007 to week 3 of 2008. The other thing I see is that in the second half of 2007, the spikes in sacks do not correspond to spikes in opposing defenses’ sacks/game. However, in 2008, for the most part, the Steelers gave up more sacks to teams with a higher sacks/game and fewer sacks to teams with a lower sacks/game statistical. This tells me that in mid to late 2007, the Steelers OL pass protection was terrible, while in 2008, it was more or less average to mediocre. But, in particular, when we look at the final six games of 2008, the sacks allowed in each of those games is around what one would expect for an average (perhaps even slightly above average) offensive line. Against the poorer pass rushing teams, they gave up fewer than that team’s average sacks/game, while against the better pass rushing teams, they were overwhelmed a little. But, at least in those cases, we don’t see any more cases like Week 10 of ’07 against the Jets or Week 3 of ’08 against the Eagles, where they gave up more than 5 and 6 sacks more than the teams’ averages, respectively.
My conclusion is that, yes, I do think the OL is improving. As some have noted, the starting 5 have had about 14 or 15 weeks together as a unit, including last year’s playoffs. And, that schedule last year was quite a gauntlet for any OL. I haven’t posted the table, but I also pulled the numbers for the 2009 Steelers opponents. Based on their 2008 rankings, we should expect a significantly lower average defensive rank this year: 17 for points, 18 for yards and rush defense. In addition, 10 of the games are against opponents that averaged fewer than 2 sacks/game last season.
So, with greater cohesiveness as they continue to work together, there is hope for improvement. I know that there is talk of Urbik beating out Stapleton, but even that change would be less change than we had over the last 2 years. From the open of 2007 to the end of 2008, only Willie Colon started every game. Every other position has gone through at least one transition. If Urbik beats Stapleton, that will only be one change, as opposed to four.
So, Steeler Nation, what are your thoughts? Still worried about the OL, or do you feel better about it now (at least a little)?

August 9, 2009 at 11:34 pm |
Offensive line is the hardest to judge. Like you said about B Arians on BTSC we don’t know what all the plays and responsibilities are. To really do justice you would need to know that info and also I would throw in who they were playing next to.
When the guy next to you changes, the game changes. We improved as the year went on, but it was a group improvement, not an individual improvement.
We lost a lot of the confusion sacks, given up on misreads and such. We didn’t get rid of the getting beat by your man sacks. (IMO of course) We will get better this year, but we will give up sacks to great pass rushers, simply because they can beat our guys.
Watch out for the vindication stories about guys bouncing back from last year to prove the critics wrong this year if the numbers drop enough. Just don’t buy into this line being very good, we need high talent at two spots on this line and we would have a good line.
August 10, 2009 at 11:49 am |
Agreed. I don’t believe this is an elite line by any stretch. But, I do think it’s very possible that this could be an above average OL this season and beyond.